March 30, 2011

Radiation Doses: Choose Your Poison

Much media attention has been focused on the events unfolding at the Fukushima 1 nuclear power plant.  Radiation levels at the plant and surrounding areas accompany almost every report but what do they actually mean?  Several charts have been published recently to help put things into perspective.

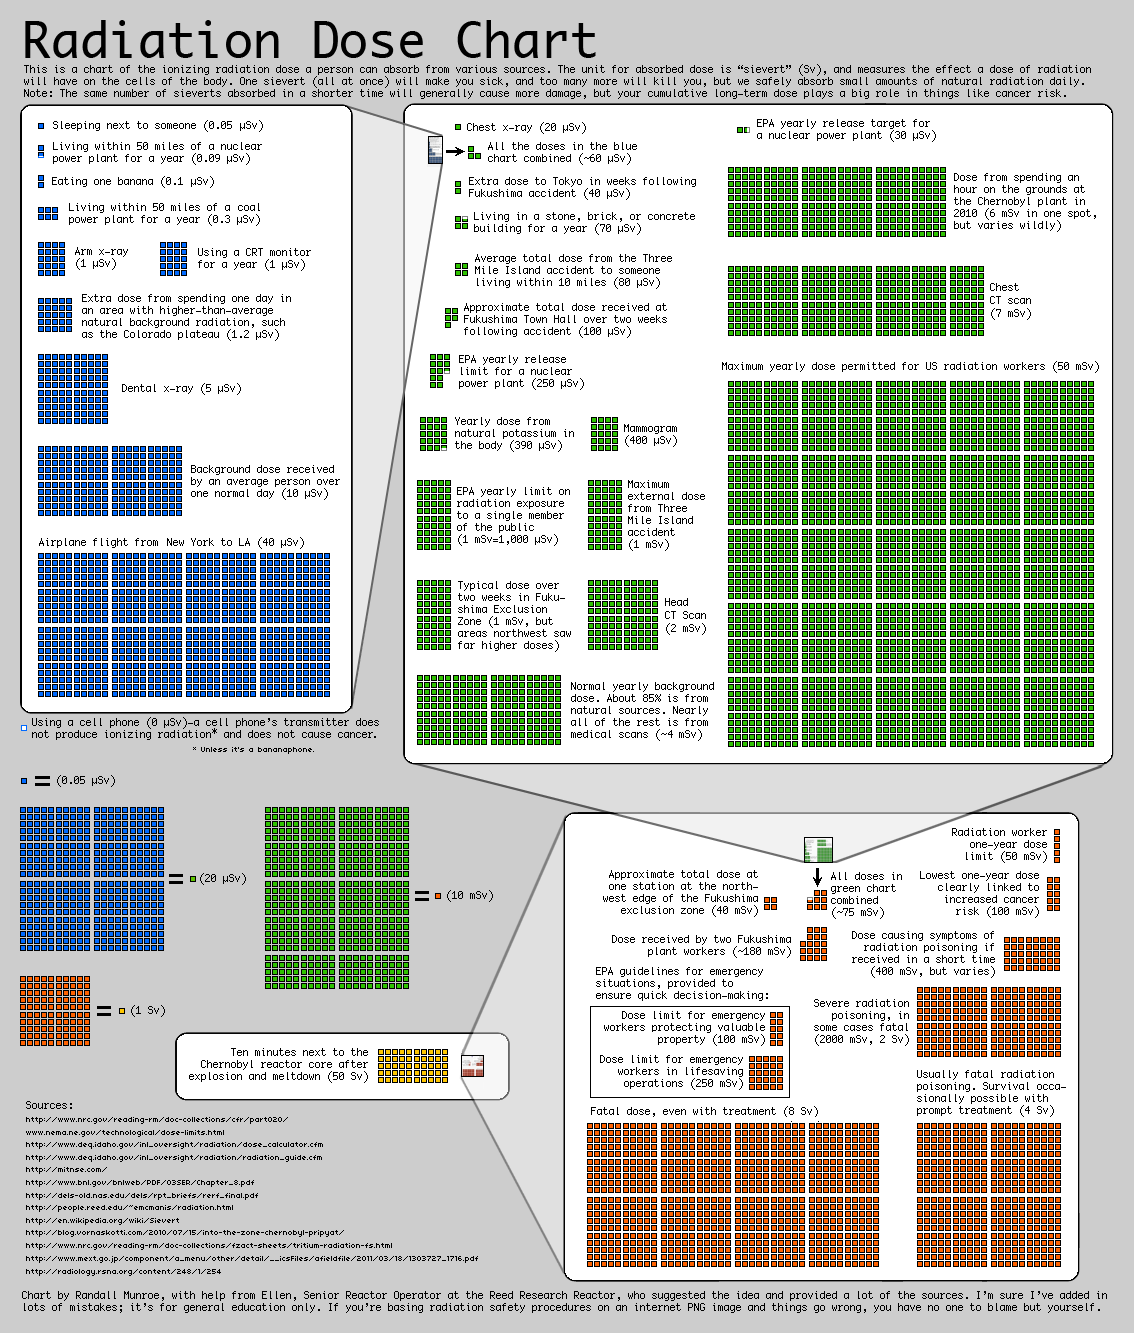
1. Randall Munroe, best known for his xkcd webcomic, published a Radiation Dose Chart.


2. Alexandra, a user at Visualizing.org posted her Nuclear Radiation infographic.


3. David McCandless of Information is Beautiful published his Radiation Dosage Chart.
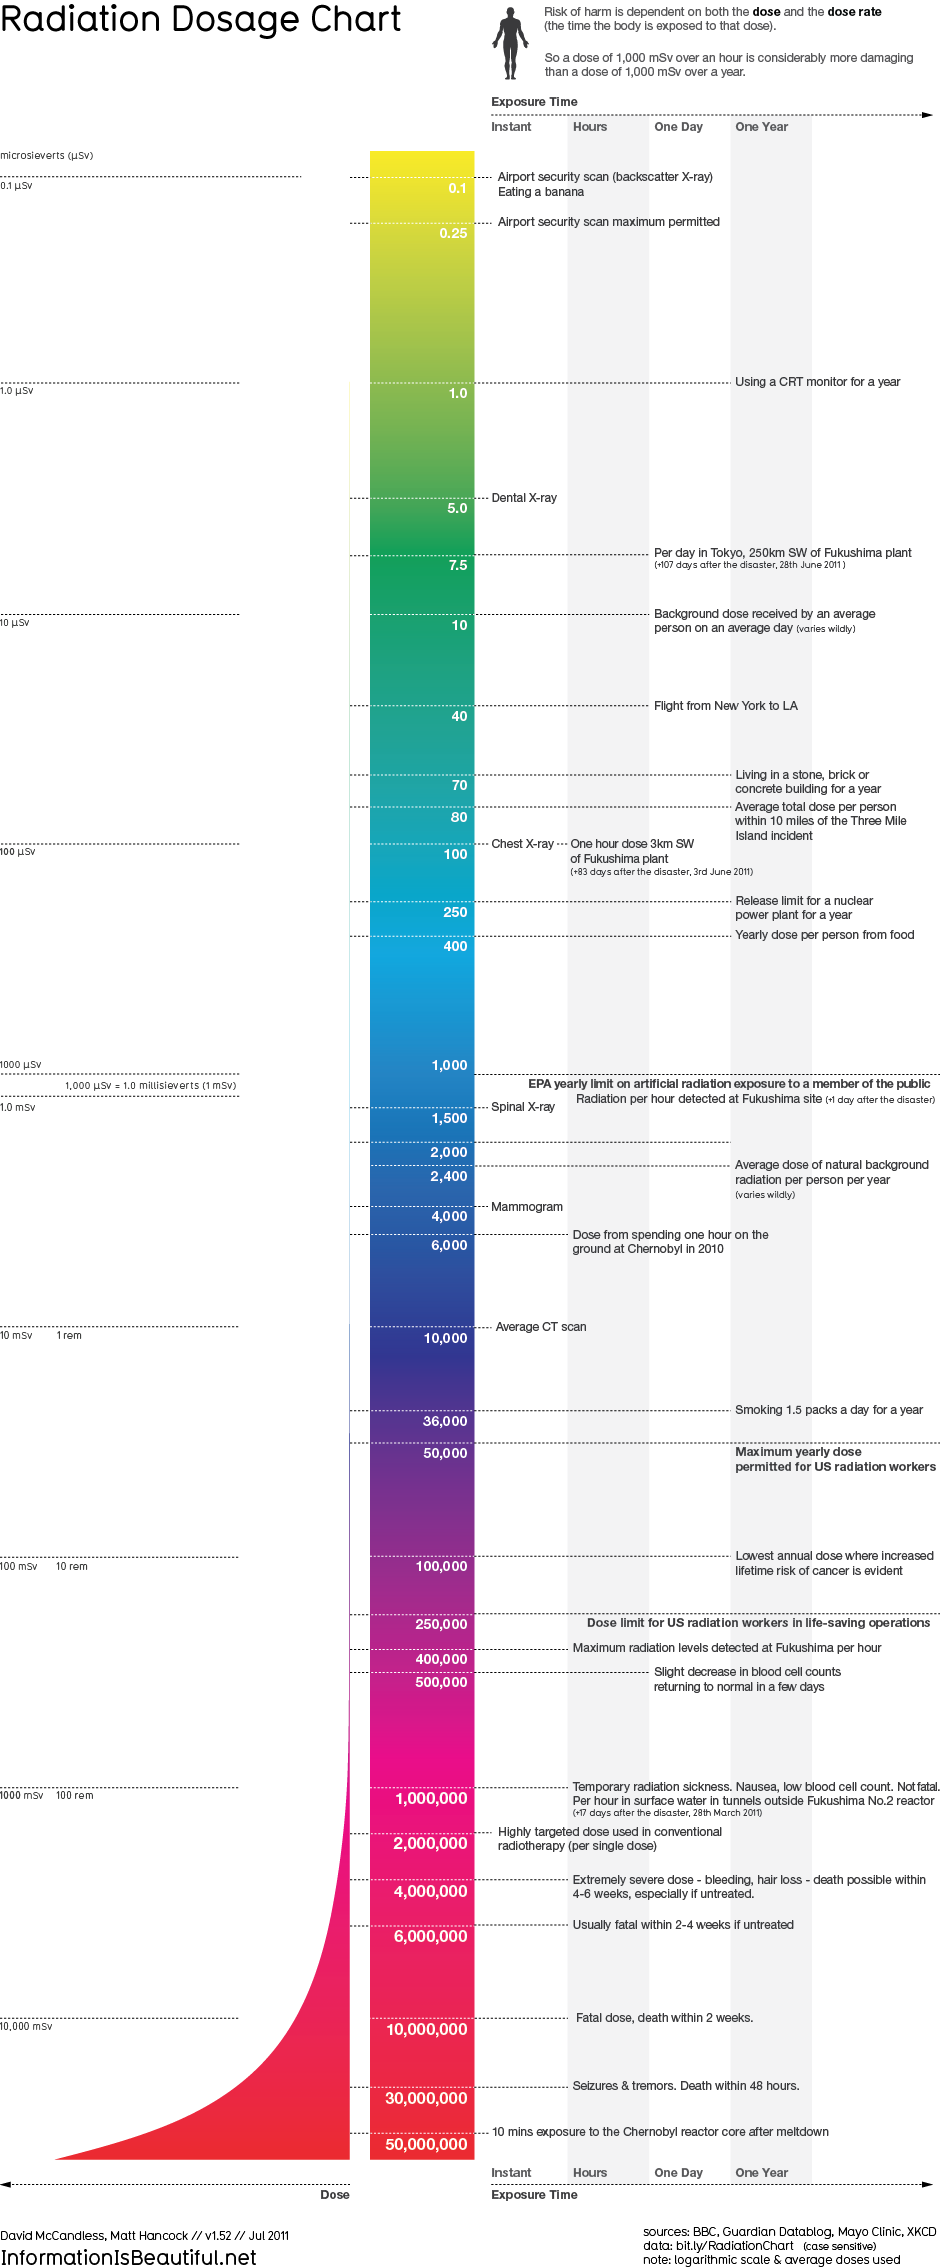


They're all quite useful, demonstrating the enormous range of measurable radiation levels from that to which we're exposed in daily life up to the lethal doses.  However, I think Alexandra's infographic is most useful as it also visualizes dose rate.  This additional dimension does make Alexandra's chart a little more difficult to comprehend but it's worth the effort.

What do you think?

If you know of any other radiation dose charts then please let me know.

March 28, 2011

Social Map: Placebook

I recently came across Social Map: Placebook, the 2010 winner of the NACIS: Student Web Mapping Competition.  The stated aim of Placebook is:
to give [a] more accurate idea on how are Facebook users [are] distributed around the world.

It's an excellent application.  I found that the most powerful feature of Placebook was not the map but rather the additional graphics used to visualize social data.  You can choose to explore:


  • absolute counts of the number of users per country,
  • the proportion of users in each country with Facebook accounts, and
  • (structure) the distribution of Facebook users by age-group in each country.

Placebook includes controls for focusing on regions (World, Europe, North Americas, South Americas, Africa, Asia and Oceania).  You can also sort the data to find interesting artefacts.  For example, I discovered that in Serbia & Montenegra a striking 77% of under-18 year olds have Facebook accounts; a significant outlier (Albania is a distant second at 30%).  The data was obtained in August 2010 using the "impact estimator" of Facebook's advertising interface.
You can also login to your own Facebook account to visualize the demographics of your own social network.  However, I chose not to as it gives Placebook access to your personal information and that of your friends.

March 24, 2011

Aesthetic Impact Survey: Please Participate


There's a long-running debate in the visualization community regarding the value of aesthetics to visualization.  For some, aesthetics or "eye candy" is considered a triumph of style over substance or form over function that serves only to confound understanding.  At the other extreme is the camp who believe that "ugly" visualizations are valueless.  Much of this opinion has little evidential support but that might be about to change.

A group of visualization researchers is conducting a user study to assess the impact of aesthetics on visualization.  The more people who participate the stronger study's conclustions will be.  The study end soon, so if you haven't already done so, please participate.

All you need is 20 minutes and a web-browser that supports Javascript and Flash.

March 22, 2011

IEEE Visualization Contest 2011

Image of turbine mesh

As part of Visweek 2011, the IEEE has announced details its annual Visualization Contest.

This year the contest focuses on computational fluid dynamics:
The goal is to devise a visualization that allows for exploring the stability of a fluid dynamics simulation of a pump with respect to different models of its turbulences. One big challenge is the large amount of the data. The contest aims at demonstrating how novel visualization and interaction techniques from the fore-front of scientific research can help to solve real-world problems of high relevance - today.

Prizes include an iPad, free registration at VisWeek 2011 and certificates for team members.  The competition deadline is July 31, 2011.

Data sets and more details are available from the contest web-site.

March 21, 2011

Immaterials: Light painting WiFi

Image of WiFi light painting


The Immaterials: Light painting WiFi project visualizes the strength of urban WiFi signals:
A four-metre tall measuring rod with 80 points of light reveals cross-sections through WiFi networks using a photographic technique called light-painting.

The resulting images are quite striking both in terms of their beauty and what they reveal about WiFi networks - that signal quality is highly variable even over a short range.  And I thought it was just my WiFi router that was like this.

Learn more about the project, browse the images or watch the video (below).

March 20, 2011

New York Times Visualization of the Japanese Earthquake Fault Plane

Visualization of the magnitude of the quake


Shortly after the devastating Japanese earthquake on March 18 2011, the New York Times published an excellent series of visualizations showing the quake's fault plane, magnitude and the predicted tsunami spreading across the Pacific Ocean.

What I found particularly enlightening was the depiction of the fault plane.  I'd previously thought of earthquakes as emanating from a point source - the word epicentre reinforces this notion.  In fact, the earthquake arose from a section of the North American plate, several hundred miles in length, being thrust upwards by the movement of the Pacific plate beneath it.  The epicentre is the focus of the earthquake at which the force is greatest.

Kudos to the New York Times for their enlightening graphics.